Understanding Messy Data
September 15, 2020
- Every day the world produces 2.5 quintillion (that’s a 2.5 with 18 zeros) bytes of data
- 90% of the world’s data has been created since 2015

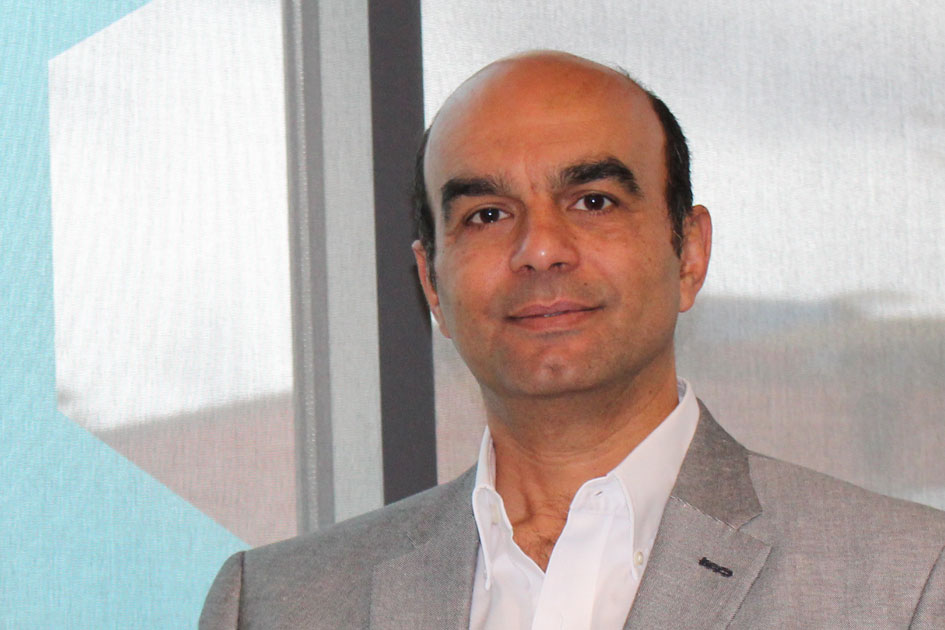
DSU Professor of Information Systems, Dr. Omar El-Gayar, knows data visualization can help “clean-up” the mess so users make sense of data.
DSU Professor of Information Systems, Dr. Omar El-Gayar, knows data visualization can help “clean-up” the mess so users make sense of data.
Data visualizations represent data in a graphical form to communicate trends, insights, or patterns in data. This can be in the form of graphs, charts, maps, or dashboards. They can also be interactive.
“Visualization of data, if done right, will tell a story to the right people, at the right time, and allow them to deal with the complex information presented more effectively. It will therefore allow the true scope of the problem faced to be realized,” he said. A current example of making sense out of data with visualizations is evident with the current COVID-19 situation.
In a recent paper, El-Gayar and colleagues showed that social media platforms can help identify important and useful knowledge shared by medical professionals during a pandemic, but “their number one concern was the spread of misinformation over social media,” El-Gayar said. “In effect, ONLY rely on data and analysis generated by reputable scientific and professional establishments.”
Researchers and data producers need to have a rigorous research methodology, including data collection and analysis with the appropriate checks and balances. Other factors include knowing the audience and balancing design elements to tell THE story, not A story. Visualization techniques and programming languages, along with machine learning, can help build powerful data visualization reports.
The end users -- the data consumers -- should critically assess the data source and have a basic understanding of how the data was collected, and be mindful of things such as the date information was collected, the size of the study group, its source and some basic graph details.
“Data visualization techniques can allow any user to gain a much deeper insight from very large volumes of data that simply would not be possible by simply looking at the numbers,” said El-Gayar.
He was featured on SDPB’s “In the Moment” discussing this topic.
MASTER OF SCIENCE IN ANALYTICS AND APPLIED ARTIFICIAL INTELLIGENCE (MSAA)
